
Corporate Earnings Summary: NVIDIA (NVDA) -- Q1 2026
Quarterly Revenue of $75.2 billion. Adjusted EPS of $1.87
Executive Summary
NVIDIA Corporation reported record-breaking financial results for the first quarter of fiscal year 2027. Total revenue reached $81.6 billion, representing a 20% sequential increase from the prior quarter and an 85% surge from the same period last year. Growth was anchored by the enterprise deployment of the Blackwell architecture platform and structural shifts toward automated intelligence systems across cloud and industrial ecosystems.
The company recorded standard GAAP net income of $58.3 billion with basic earnings per share of $2.40 and diluted earnings per share of $2.39. This exceptional profitability was enhanced by substantial valuation gains in equity holdings. Non-GAAP net income stood at $45.5 billion, reflecting a revised calculation methodology that now embeds employee equity incentives into normalized operational figures. Operational free cash flow reached $48.6 billion for the quarter.
NVIDIA announced major capital return initiatives, including an additional $80.0 billion share repurchase authorization and a twenty-five-fold expansion of its regular quarterly cash dividend to $0.25 per share.
Business Description and Strategic Vision
NVIDIA pioneered accelerated computing to solve complex processing challenges that traditional sequential models cannot handle efficiently. The company has transitioned from personal computer graphics to data-center-scale infrastructure. Its architecture integrates graphics processing units, central processors, high-performance networking, and proprietary software libraries.
The current corporate strategy focuses on infrastructure for agentic AI and physical AI. Management views this macroeconomic shift as the emergence of AI factories, processing data into operational intelligence and digital assets. To maintain market share, NVIDIA utilizes a unified architecture across its ecosystem, ensuring software runs identically across high-performance data centers, edge infrastructure, workstations, and desktop environments.
NVIDIA operates via two standard reportable accounting segments:
Compute & Networking: Includes advanced data center accelerated computing platforms, high-speed end-to-end networking solutions, specialized software suites, and automated vehicular platforms.
Graphics: Incorporates desktop and notebook graphics processing units for digital gaming, consumer computing platforms, and high-performance visual processing units for professional design workstations.
Market Platforms and Product Portfolio
NVIDIA adopted a new financial reporting framework in the first quarter of fiscal year 2027 to map revenue directly to its primary growth vectors. Corporate financial results are now consolidated under two primary market platforms: Data Center and Edge Computing.
Data Center Platform
The Data Center platform constitutes the core of NVIDIA’s revenue engine, accounting for $75.2 billion, or approximately 92.2% of total corporate revenue in the first quarter. This platform is divided into two operational sub-markets:
Hyperscale Sub-Market
This division covers commercial deployments within large-scale public cloud architectures and the world’s largest consumer internet enterprises. Hyperscale demand represented roughly 50% of total Data Center revenue during the period. Purchases were driven by deep learning training infrastructures and large-scale model deployments.
AI Clouds, Industrial, & Enterprise (ACIE) Sub-Market
This segment addresses purpose-built data facilities, local sovereign computing clusters, and deep enterprise implementations across private industries and regional nations. ACIE revenue grew to $37.4 billion, matching hyperscaler scale due to the rapid diversification of enterprise AI model deployment outside of the traditional public cloud boundaries.
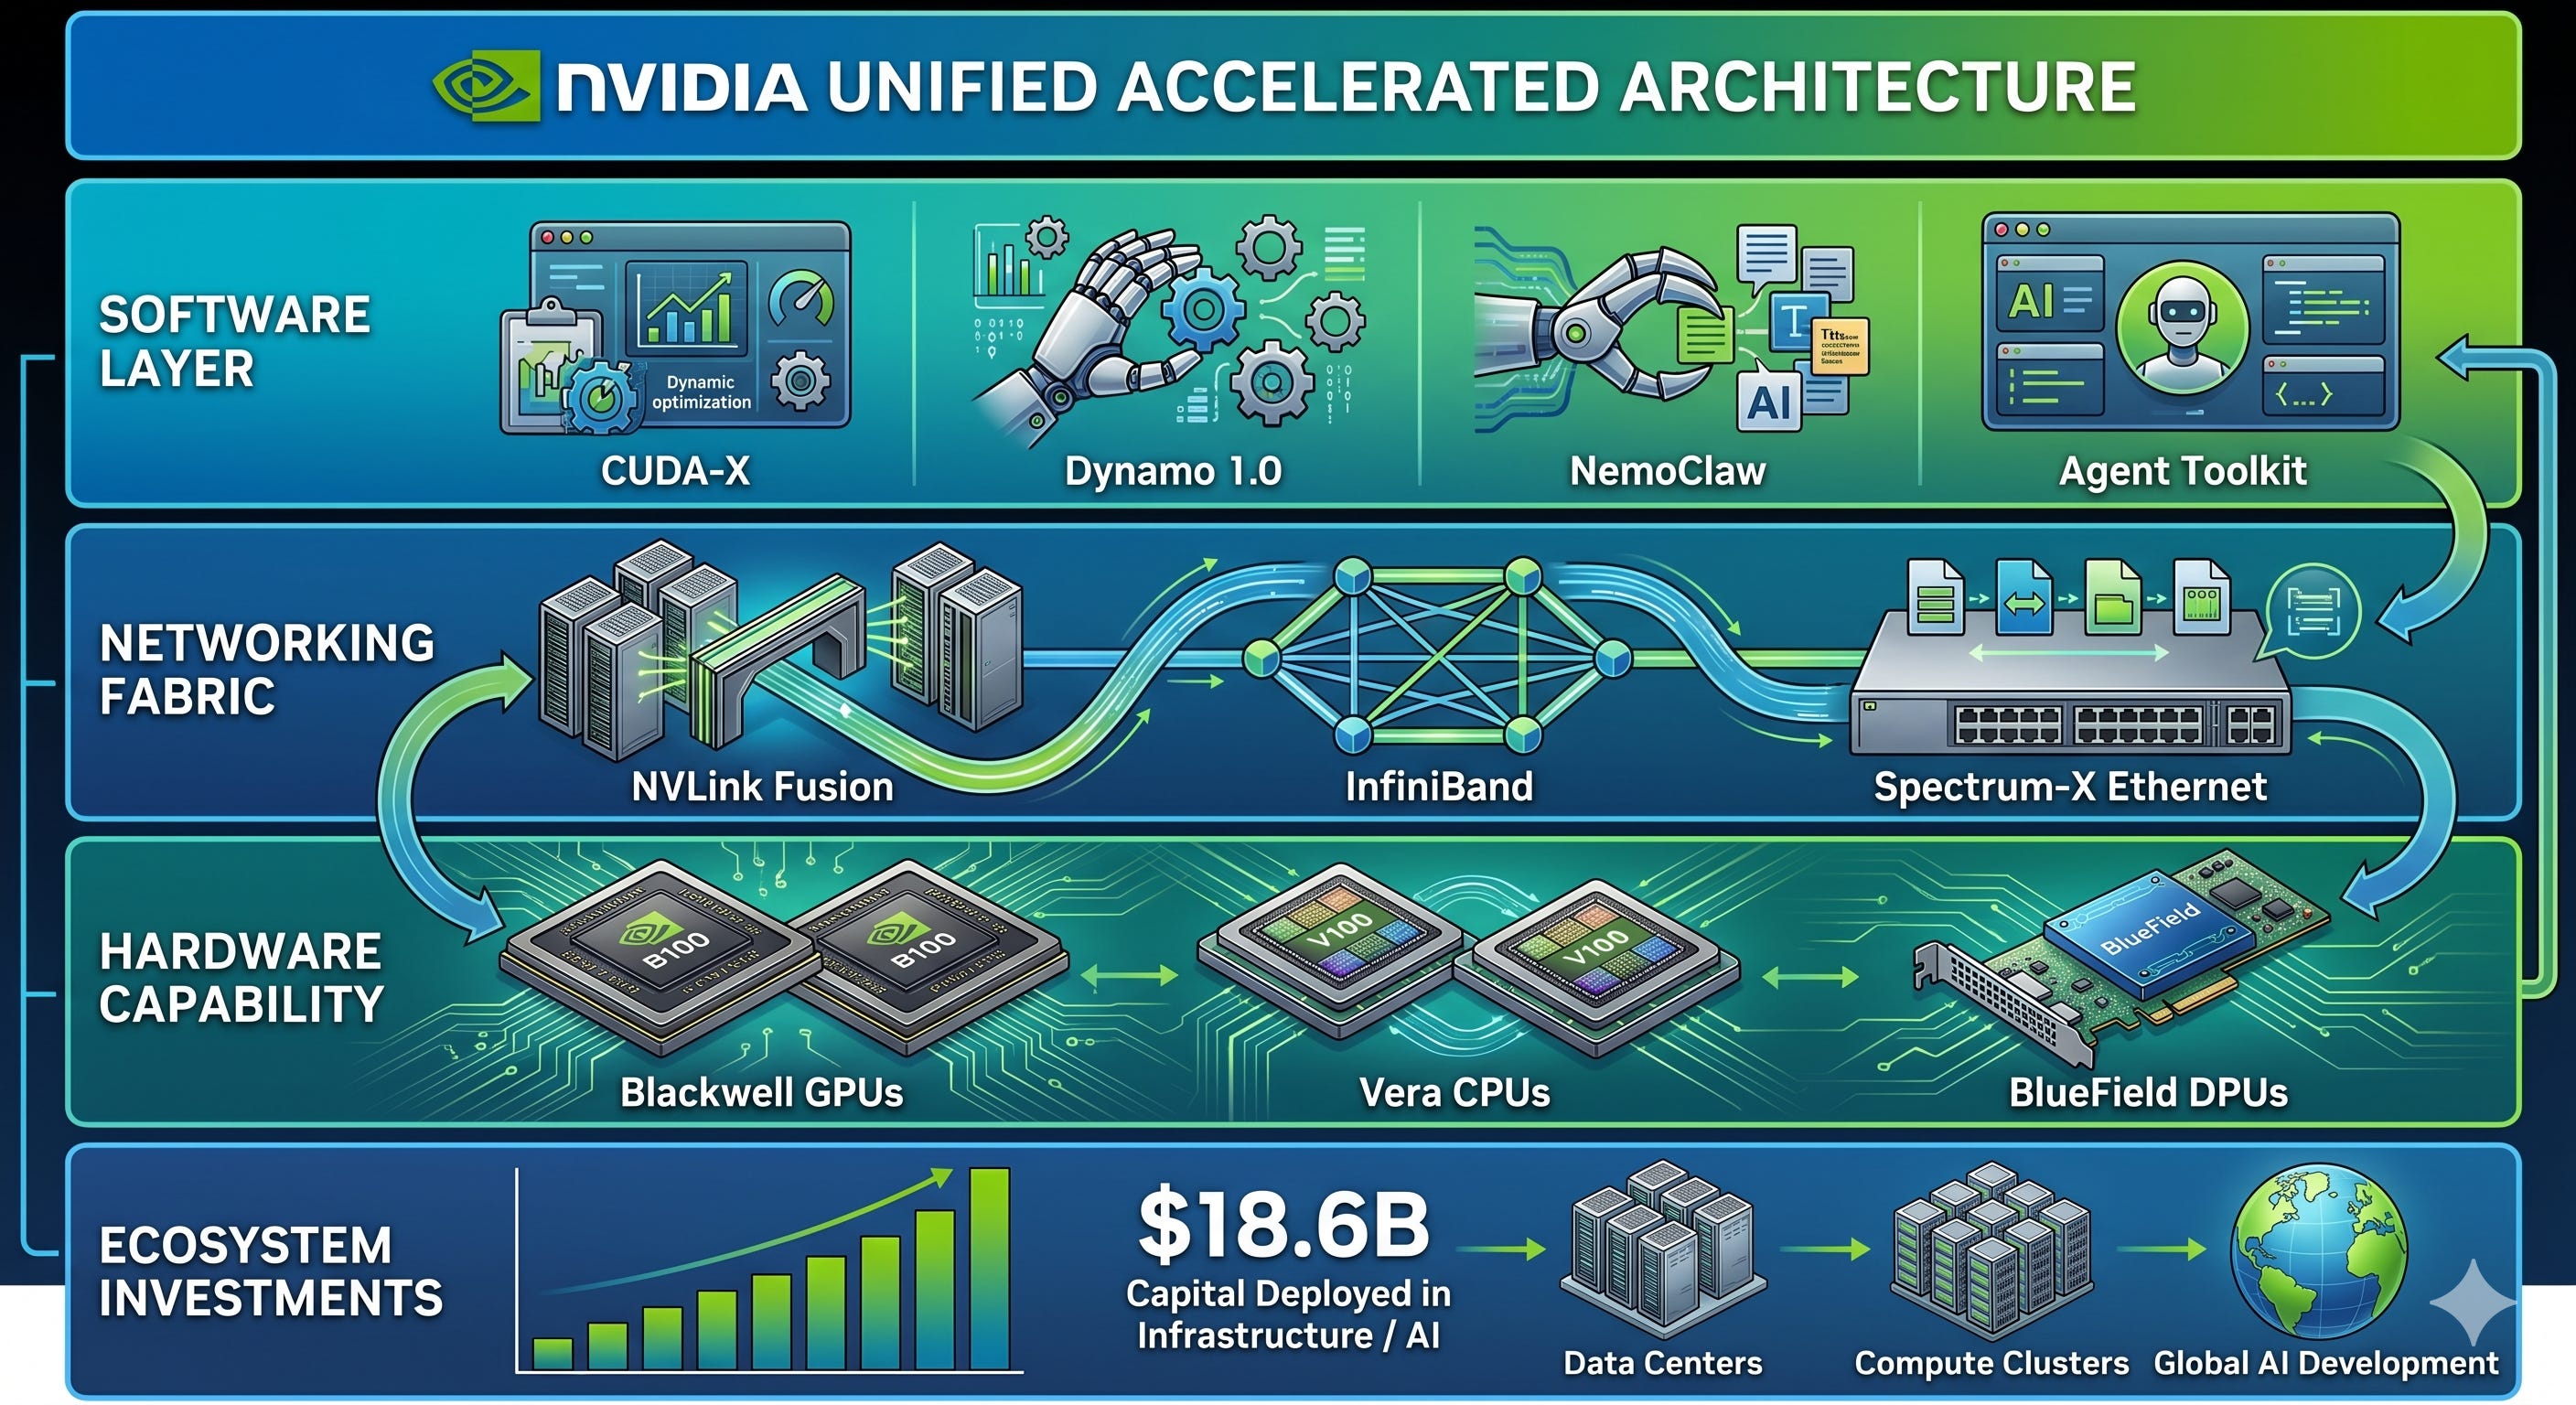
Product execution within the Data Center platform was led by the volume production and system deployment of the Blackwell architecture. Compute infrastructure was paired with high-speed networking fabrics, including InfiniBand architectures, Spectrum-X Ethernet switches, and NVLink high-speed computing fabrics. NVIDIA also expanded its future product roadmap by highlighting the upcoming Vera Rubin platform. This architecture introduces the Vera CPU, built specifically to optimize automated decision-making workflows, and the BlueField-4 STX platform to secure next-generation storage handling within complex computing clusters.
On the software layer, the firm launched Dynamo 1.0, an open-source inference solution that provides up to a 7x speed boost for generative modeling on Blackwell hardware. Additional infrastructure tools were introduced, including NemoClaw for autonomous agent structures, OpenShell for privacy management, and the comprehensive Agent Toolkit to streamline private enterprise system development.
Edge Computing Platform
The Edge Computing platform unifies all processing environments positioned outside the centralized cloud data center. This framework brings physical AI and localized processing to personal computers, mobile workstations, localized networks, digital gaming systems, robotics, and advanced vehicular architectures. First-quarter Edge Computing revenue totaled $6.4 billion, growing 29% compared to the prior year.
Key product and technology milestones within Edge Computing include:
Graphics and Gaming: Release of DLSS 4.5 Dynamic Multi Frame Generation and early previews of DLSS 5, which introduces three-dimensional guided neural rendering models to advance visual processing.
Autonomous Transportation: Expansion of the DRIVE Hyperion system architecture and the deployment of full-stack DRIVE AV software packages. Partner networks expanded via long-term deployment agreements with automakers including Hyundai Motor Company, Kia, BYD, Geely, Isuzu, and Nissan. A strategic operational fleet partnership was extended with Uber to launch autonomous driving platforms powered by NVIDIA computing hardware. The firm also introduced Halos OS to serve as a unified structural safety core for intelligent software-driven vehicle models.
Industrial Automation and Localized Networks: General availability of the IGX Thor computing module to process intensive real-time physical AI tasks within modern automated manufacturing lines. Telecom integration progressed through a multi-party development agreement with T-Mobile and Nokia to test real-time physical applications over intelligent AI-RAN cellular base stations and open-architecture 6G wireless nodes.
Corporate Strategy and Ecosystem Ecosystem
NVIDIA executes an aggressive corporate strategy to construct an insurmountable ecosystem moat around its core silicon business. This involves an annual accelerated product iteration cycle, deep integration of proprietary software, and extensive financial investments into upstream and downstream ecosystem partners.
Strategic Ecosystem Investments
During the first quarter of fiscal year 2027, NVIDIA deployed an immense $18.6 billion into private corporations, infrastructure funds, and early-stage technology entities. These allocations are deliberately positioned to cultivate downstream customer demand. For example, by funding advanced AI model developers, NVIDIA indirectly supports cloud-based infrastructure consumption, as these entities regularly deploy their software applications across centralized public cloud platforms built on NVIDIA hardware engines.
Technological Alliances
To secure its technical supply chain and scale the physical deployment of massive data architectures, NVIDIA formed deep design collaborations with critical ecosystem partners:
Marvell: A deep strategic partnership utilizing NVLink Fusion technology to co-develop silicon photonics architectures, bypassing electrical data transmission bottlenecks inside massive scale compute clusters.
Advanced Optics Providers: Multi-year research and delivery agreements were signed with Coherent, Corning, and Lumentum to secure fiber-optic innovations required to handle the data transmission loads of modern computing farms.
Google Cloud: Expanded infrastructure integration featuring next-generation A5X server instances driven by Vera Rubin hardware, alongside developer access to Google Gemini software model previews across internal corporate infrastructure environments.
Financial and Operational Performance Analysis
Revenue
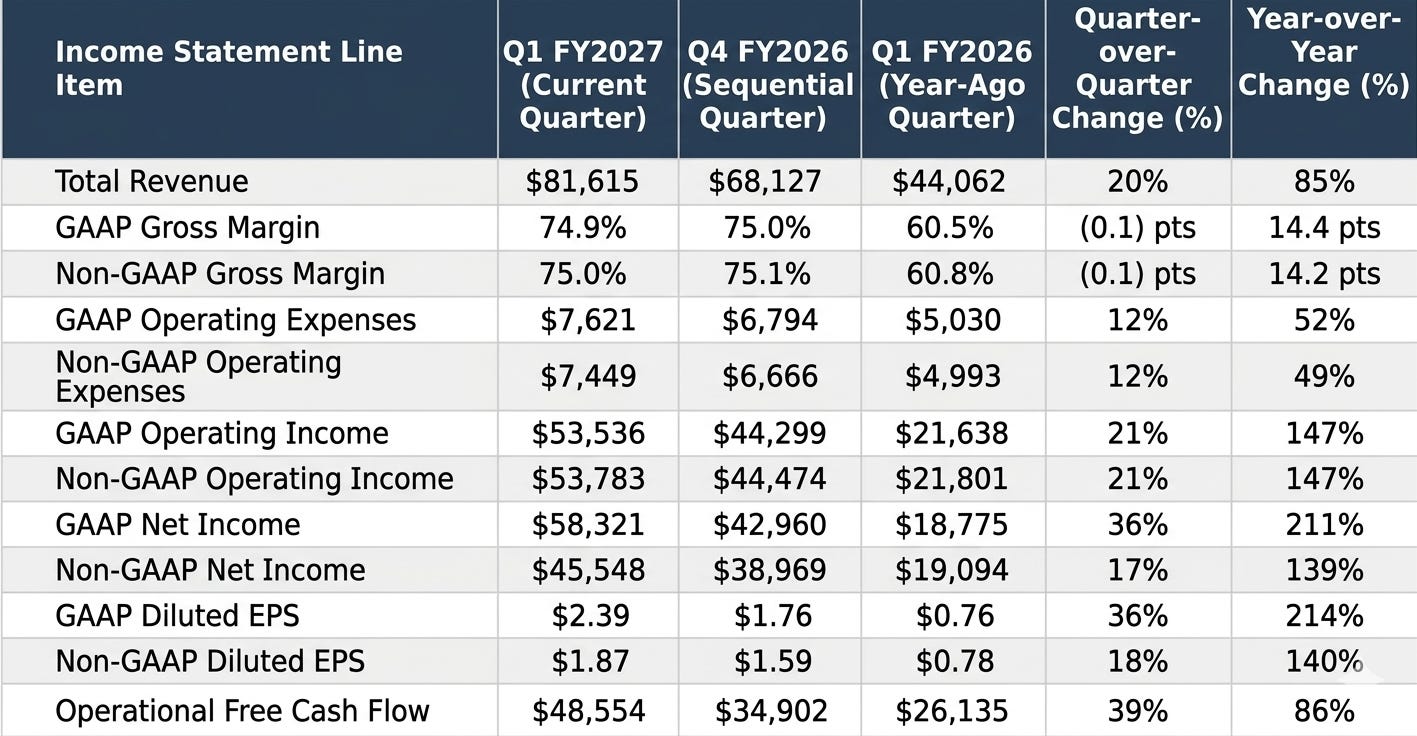
Total revenue of $81.6 billion grew 85% compared to $44.1 billion in the first quarter of fiscal year 2026. Sequential revenue grew 20% from $68.1 billion in the fourth quarter of fiscal year 2026, demonstrating sustained quarterly demand without structural flattening.
Gross Profit and Margin Execution
GAAP gross margin reached 74.9%, expanding 14.4 percentage points from 60.5% in the prior year’s opening quarter. This margin recovery was driven by the non-recurrence of a massive $4.5 billion inventory penalty recorded in the first quarter of fiscal year 2026, which was tied to excess H20 inventory provisions and outstanding supplier purchase liabilities. Sequentially, GAAP gross margin was flat, sliding slightly by 0.1 percentage points from 75.0% due to the stable production costs and structural pricing mix of the Blackwell system architecture.
Operating Expenses
Total GAAP operating expenses rose 52% year-over-year to $7.6 billion. This expansion was driven by a 112% surge in internal compute and development infrastructure usage, a 31% expansion in base payroll and employee compensation structures to support organizational scaling, and a 204% expansion in engineering prototype materials required for the rapid qualification of next-generation product platforms. Research and development allocations comprised the vast majority of total overhead, standing at $6.3 billion.
Operating Income
GAAP operating income increased 147% year-over-year to $53.5 billion, resulting in an operating margin of 65.6%. Non-GAAP operating income reached $53.8 billion.
Non-Operating Income and Equity Tailwinds
The GAAP financial statements were significantly influenced by a massive $15.9 billion net gain recorded under other income and expense lines. This non-operating surge was driven by massive unrealized market valuation gains across the company’s publicly traded and non-marketable equity investment holdings.
Net Income and Earnings Per Share
GAAP net income reached $58.3 billion, a 211% expansion over the $18.8 billion reported in the first quarter of fiscal year 2026. Diluted GAAP earnings per share rose 214% to $2.39. Non-GAAP net income reached $45.5 billion, resulting in diluted earnings per share of $1.87.
Non-GAAP Presentation Structural Shift
Effective the first quarter of fiscal year 2027, NVIDIA implemented a critical structural revision to its non-GAAP financial reporting framework. Normalized non-GAAP measures no longer exclude stock-based compensation expenses from operational figures. Management enacted this adjustment because equity incentives represent a core, recurring component of its talent retention and compensation program. All historical non-GAAP financial comparisons have been retroactively recast to embed stock-based compensation costs.
Because stock-based compensation is included in non-GAAP figures, but the massive $15.9 billion unrealized equity investment gain is stripped out of non-GAAP metrics, NVIDIA’s non-GAAP net income ($45.5 billion) and non-GAAP diluted EPS ($1.87) are lower than their GAAP counterparts ($58.3 billion and $2.39) for this period.
Operational Accounting Segment Results
From an accounting segment view, performance was heavily weighted toward specialized processing nodes:
Compute & Networking Segment: Revenue increased 88% year-over-year to $74.6 billion. Segment operating income expanded 142% to $53.3 billion, driven by the Blackwell product ramp and the non-recurrence of the prior year’s inventory charges.
Graphics Segment: Revenue grew 58% year-over-year to $7.1 billion, supported by the rollout of consumer and desktop solutions matching the Blackwell design framework. Segment operating income expanded 79% to $2.9 billion.
Geographic Dispersion and Customer Concentration
NVIDIA records geographic revenue based on the historical corporate headquarters location of its direct buyers, which can differ from final device deployment destinations or customer delivery locations. The United States remains the company’s largest market platform by headquarters location, generating $63.8 billion in revenue. Taiwan generated $12.0 billion, while China (including Hong Kong) recorded $9.7 billion. International headquarters accounted for 22% of total corporate revenue, down from 42% in the prior year’s opening quarter.
Financial risk is concentrated across a small, highly unified buyer ecosystem. During the first quarter, three direct purchasing customers represented 21%, 17%, and 16% of total corporate revenue, respectively. Sales to these three entities accounted for 54% of total revenue and were almost entirely tied to the Compute & Networking operational segment. On an indirect basis, revenue concentration is also elevated. Management noted that a single prominent AI research and deployment enterprise contributed a meaningful portion of total quarterly revenue by consuming extensive cloud services from NVIDIA’s primary hyperscale customers.
Balance Sheet, Cash Flow, and Capital Allocation
Cash Position and Liquidity Profiling
NVIDIA maintains an exceptional liquidity position. As of April 26, 2026, total combined cash, cash equivalents, and marketable debt securities stood at $50.3 billion. This capital base is augmented by an additional $30.2 billion in highly liquid marketable equity securities, bringing total core financial reserves to more than $80.5 billion. Substantially all corporate cash reserves are held within domestic financial accounts and are available for immediate corporate application without incurring additional federal tax penalties.
Working Capital and Operational Commitments
Accounts Receivable: Total outstanding receivables stood at $40.7 billion. Days sales outstanding (DSO) contracted from 51 days in the prior quarter to 45 days, driven by rapid customer payment schedules and cash collections settled ahead of standard seasonal billing cycles.
Inventory Positioning: Total on-hand inventory expanded sequentially from $21.4 billion to $25.8 billion to prepare for scaling Blackwell system deliveries over subsequent quarters. On-hand inventory included $6.6 billion in raw input items, $9.9 billion in work-in-process manufacturing cycles, and $9.2 billion in completed finished products.
Supply-Related Commitments: Total outstanding non-cancellable supply purchase commitments and prepaid factory capacity obligations reached a massive $119.0 billion. Out of this total balance, $95.0 billion is scheduled for cash settlement during the remainder of fiscal year 2027 to lock in critical foundry access and component supply channels.
Lease and Service Commitments: Long-term multi-year cloud service contract commitments stood at $30.0 billion to ensure adequate computing power for internal research operations. Additionally, the firm expects to execute $32.4 billion in future data center facility leases between the second quarter of fiscal year 2027 and fiscal year 2033, with contract durations ranging up to 20 years.
Cash Flow Generation
Operational cash generation reached a record $50.3 billion for the 13-week period, expanding significantly from $27.4 billion in the prior year’s opening quarter. This sequential cash expansion was aided by temporary cash tax tailwinds, as the company made zero federal income tax cash payments during the quarter. Cash outlays for capital expenditures, including property acquisitions and intangible software asset purchases, totaled $1.8 billion, yielding free cash flow of $48.6 billion. Investing activities also consumed $18.6 billion for private placements and infrastructure allocations.
Capital Returns to Shareholders
NVIDIA used its massive free cash flow to execute record shareholder capital returns, deploying $20.0 billion via share buybacks and dividend payments.
FIRST QUARTER CAPITAL RETURNS
+-----------------------------------------------------------+
| Share Repurchases: $19.8 Billion (108 Million Shares)     |
+-----------------------------------------------------------+
| Cash Dividends Paid: $243 Million ($0.01 per Share)      |
+-----------------------------------------------------------+
During the quarter, the corporation repurchased 108 million common shares on the open market for a total consideration of $19.8 billion. Following these transactions, the remaining capacity under the historical buyback program stood at $38.5 billion. On May 18, 2026, the Board of Directors expanded this program by authorizing an additional $80.0 billion in share repurchase capacity, which carries no expiration date.
Concurrently, the Board approved a 2,400% increase in the quarterly cash dividend, raising it from $0.01 per share to $0.25 per share of common stock. The expanded dividend is scheduled for payout on June 26, 2026, to all shareholders of record as of June 4, 2026.
Future Outlook and Key Risk Factors
Second Quarter Fiscal 2027 Guidance
NVIDIA’s forward-looking financial targets for the second quarter of fiscal year 2027 include:
Expected Revenue: $91.0 billion, plus or minus 2%.
Gross Margin Targets: GAAP gross margin is projected at 74.9%, while non-GAAP gross margin is targeted at 75.0%, each subject to a variance of plus or minus 50 basis points.
Operating Expenses: GAAP overhead is estimated at $8.5 billion, and non-GAAP operational expenses are projected at $8.3 billion.
Annual Tax Rates: Full-year operational tax rates are modeled between 16.0% and 18.0%, excluding any discrete structural adjustments or material changes to the geopolitical tax landscape.
China Revenue Assumption: Forward revenue guidance assumes zero data center compute revenue from the Chinese market due to ongoing export compliance restrictions.
Structural and Strategic Business Challenges
International Export Controls and Regulatory Foreclosure
NVIDIA operates under tightening export controls imposed by the United States and international authorities. Government mandates enforce strict performance caps on hardware shipments to China, Russia, and designated regions across the Middle East and Asia. In April 2025, licensing frameworks were expanded to restrict the H20 integrated circuit architecture. This restriction severely reduced Chinese customer demand, contributing to a $4.5 billion inventory write-down in fiscal year 2026.
NVIDIA is effectively blocked from competing in China’s high-performance data center computing market. This exclusion allows regional Chinese competitors to expand their developer ecosystems and challenge NVIDIA’s long-term international positioning. While federal regulators granted limited licenses beginning February 2026 to import low-volume H200 variants to specific Chinese customers, these shipments require mandatory domestic testing and face a 25% import tariff, preventing commercial traction.
International regulatory pressure has intensified. In September 2025, China’s antitrust regulators published preliminary findings alleging that NVIDIA’s export-compliance changes unfairly discriminated against Chinese enterprises, creating compliance risks under historical Mellanox acquisition agreements. Concurrently, the French Competition Authority, the European Commission, the United States, and South Korea continue broad investigations exploring potential market dominance in graphics processing units, supply allocation choices, and ecosystem venture investments.
Supply Chain Complexity and Advanced Node Dependency
The corporate business model relies completely on external fabrication facilities, assembly nodes, and complex packaging partners located primarily within Taiwan and South Korea. The production of modern architectures involves long manufacturing lead times that frequently exceed 12 months. Because NVIDIA places non-cancellable purchase orders well in advance of final shipments, any sudden drop in customer demand can cause immediate excess inventory liabilities. Conversely, if demand is underestimated, structural component shortages can limit system output and cause significant revenue volatility.
Macroeconomic Externalities and Customer Resource Constraints
The successful scaling of NVIDIA’s technology depends on external infrastructure factors outside its direct control. Customers require massive data center floor space, immense capital access, and vast electricity grid allocations to support large-scale hardware deployments. Expanding commercial energy infrastructure is a complex, multi-year process facing technical and regulatory bottlenecks. Any delays in power utility deployment or tightening credit access for less-capitalized customers could postpone data center buildouts and compress NVIDIA’s future hardware revenue.
Technology Transitions and Open-Source Competitiveness
NVIDIA’s compressed annual product rollout schedule increases operational execution risks. Managing overlapping product lifecycles can trigger revenue volatility when customers delay purchases to wait for next-generation platforms like the Rubin architecture.
The expansion of high-quality open-source foundation models allows developers to shift toward specialized application-specific integrated circuits (ASICs) or custom internal hardware developed by hyperscale customers. This structural migration reduces the aggregate demand for generalized graphics processing platforms.
Material Legal and Litigation Risks
NVIDIA faces ongoing litigation regarding its historical financial reporting. A long-standing securities class action lawsuit alleges that corporate executives made misleading disclosures regarding channel inventory and cryptocurrency mining exposure between 2017 and 2018. On March 25, 2026, the federal district court certified the investor class. NVIDIA filed a petition to appeal this certification order on April 8, 2026. Multiple related shareholder derivative actions remain stayed in Delaware and California pending final resolution of the primary class action. No financial liabilities have been accrued for these actions, as management believes potential losses are not currently probable or reasonably estimable.