
Technical Analysis: Bitcoin (AVWAP, EMA, Fib Channel)
As Bitcoin approaches this major AVWAP support boundary, there are some things to keep in mind.
Bitcoin is currently at a critical technical juncture. Here is our analysis of the current momentum and the strategic implications. We’ll primarily use the Anchored Value Weighted Average Price (AVWAP) for our analysis.
AVWAP serves as an objective measurement of whether buyers or sellers are in control of the market.
Over the last 4 days, Bitcoin’s price action shows a failed breakout attempt followed by a sharp short-term pullback. Looking at the latest daily data, the market initially rallied from a low of $67,435, the moving up to print a high of $72,000.
We can also see that price as price as tested a Fibonacci level, it has rebounded, only to then pull back again to test the next higher fib level.
We’re now re-testing the .382 fib, so we’re watching this closely.
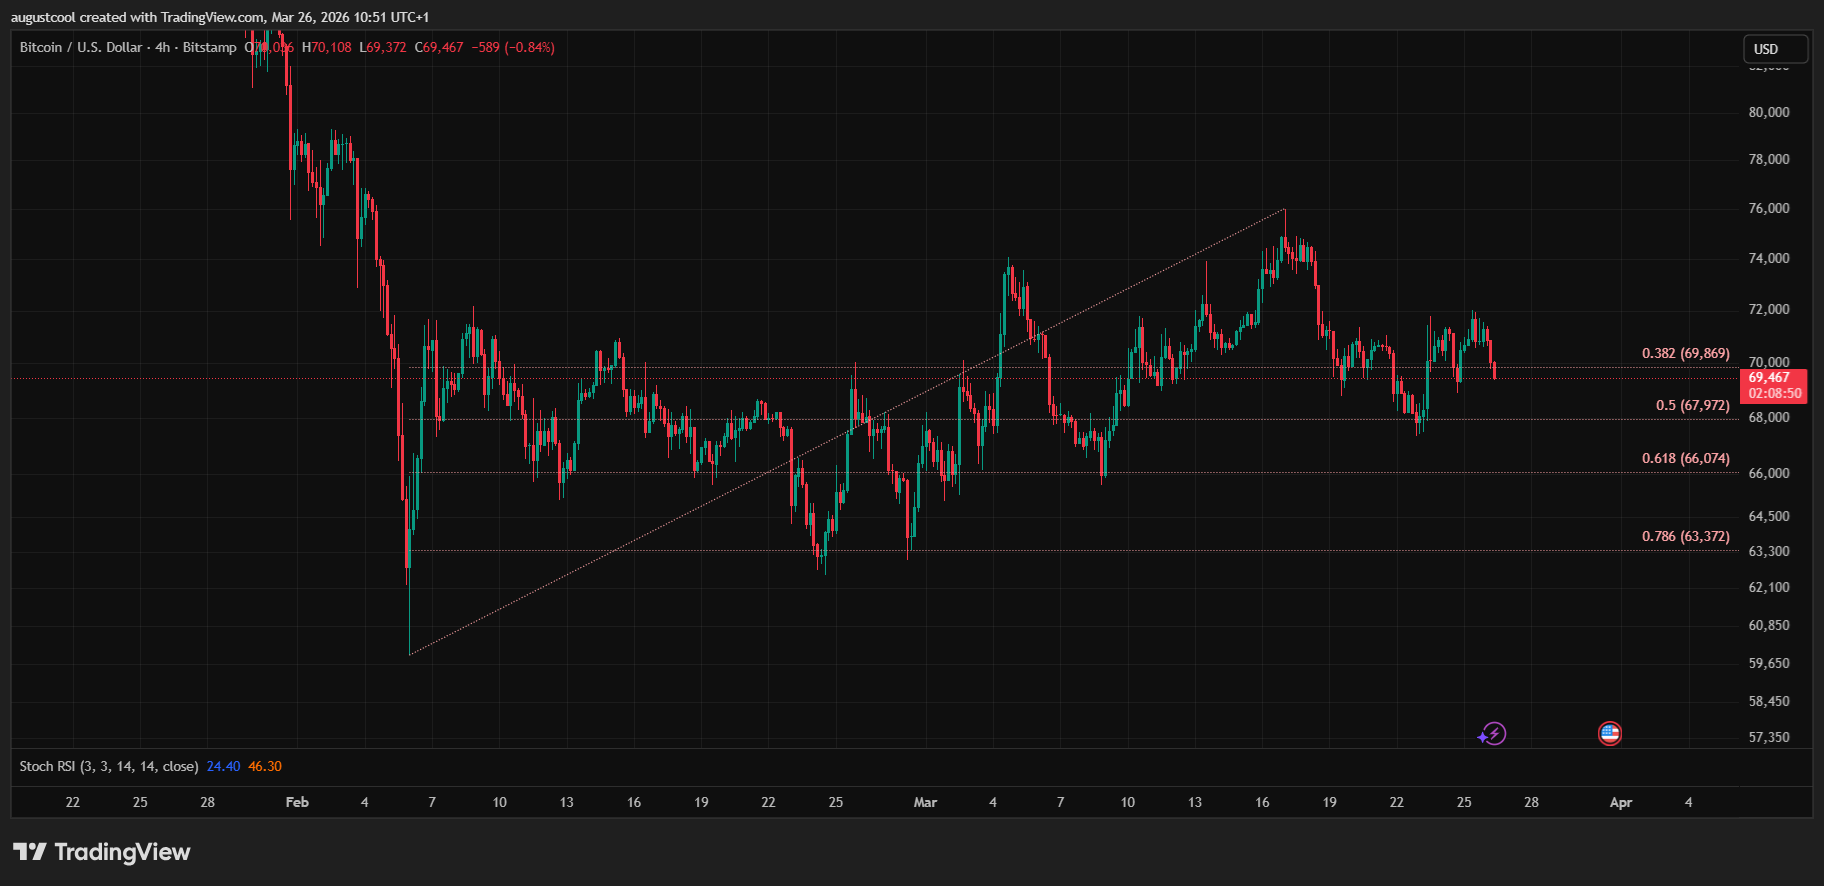
We have observed that fib channels have had relatively strong influence on both low- and medium-timeframes since the all-time high. Here we see the upward channel from the February lows. We’re now testing one of the fib levels in this channel.

From the highs earlier this week, buyers were unable to sustain those higher prices. Selling pressure entered the market on Tuesday, forcing the price back down to $67,900.
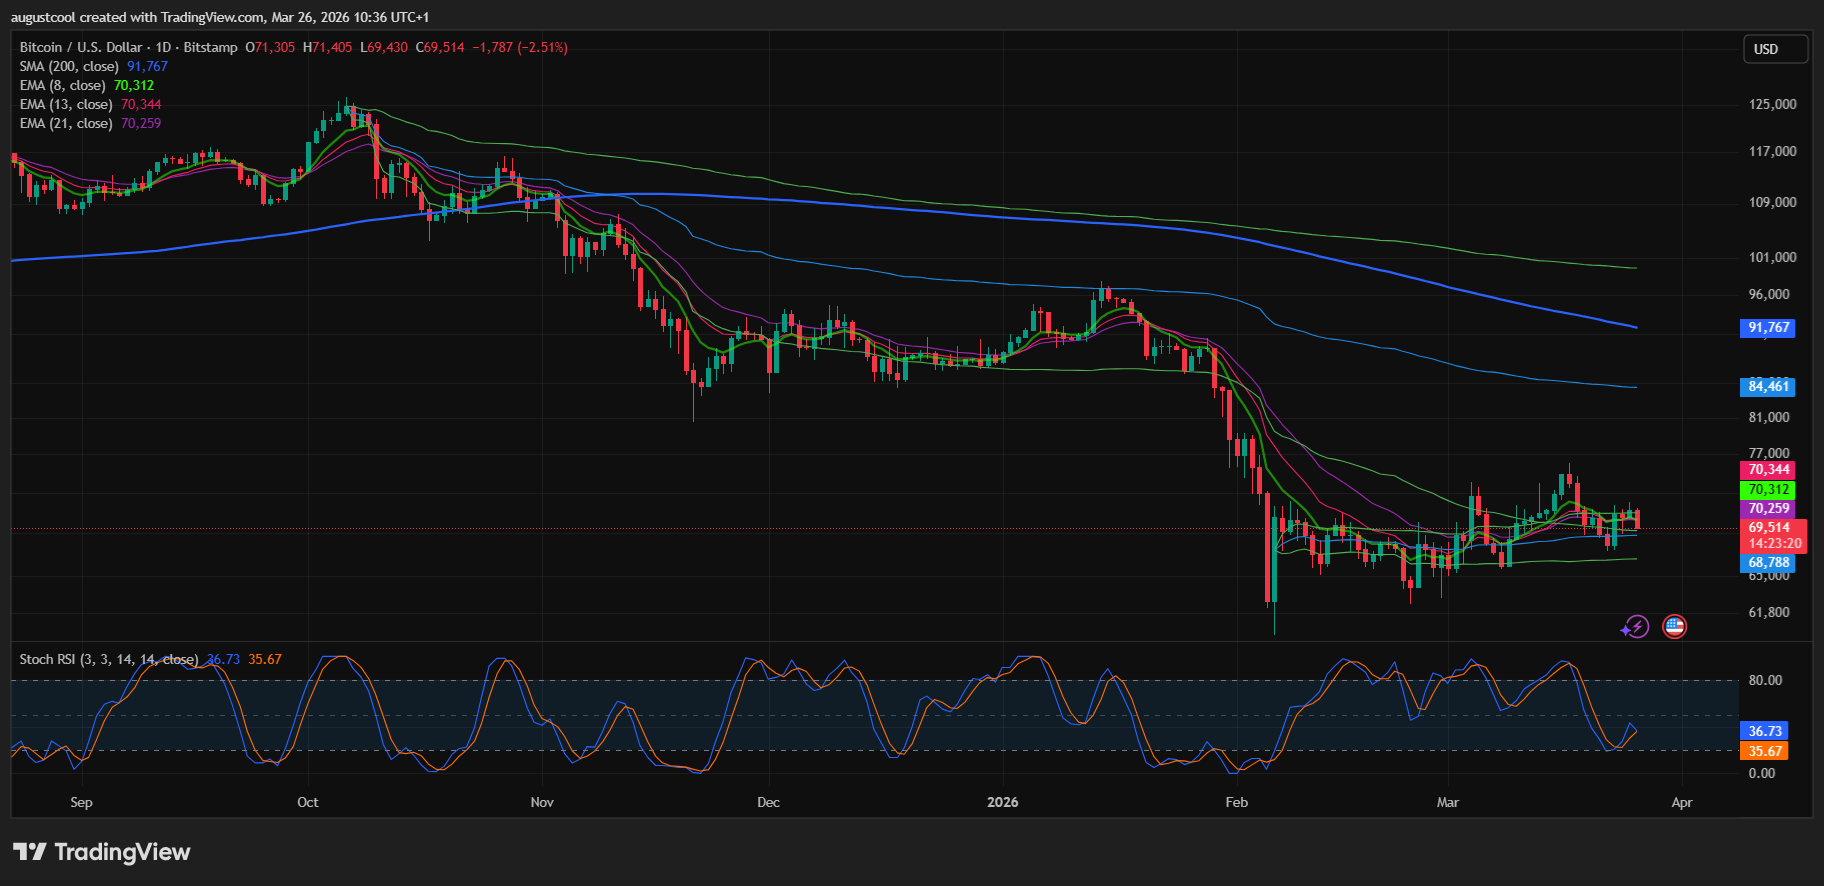
This reversal has visibly damaged the short-term momentum. On the daily chart, the fastest moving average—the 8 EMA (now at 70,329) has crossed below the13EMA(70,355) and is compressing against the 21 EMA ($70,266).
Because the current price is trading below all three of these short-term EMAs, the immediate intraday momentum is structurally controlled by sellers.
Bitcoin is now actively dropping to test its hidden structural support near $68,800 — the rising Anchored VWAP (AVWAP) tied to the February swing low.
As Bitcoin approaches this major AVWAP support boundary, there are some things to keep in mind:
The core philosophy of this strategy is to never buy an asset just because it appears cheap after a drop. With the 8 EMA declining and price action dominated by sellers, catching a falling knife is highly risky. Rallies in this environment have lower odds of following through.
While an AVWAP from a significant low often acts as dynamic support, the rules explicitly warn that the more times this AVWAP support is tested, the more likely it is to eventually fail.
Because the primary trend from the February low has been up, institutions and market makers may try to trigger a shake-out. This involves pushing the price sharply below the AVWAP to flush out retail traders with tight stop-losses, only to rapidly buy the liquidity and snap the price back above the line.
Instead of using the aggressive buy the touch method (which has a higher failure rate), conservative traders should wait for price to interact with the AVWAP and successfully bounce away. You must wait for structural evidence—such as price reclaiming the 5-day or 8-day moving averages—to prove that buyers have actually regained control.
If the price slices through the February AVWAP and stays there, it is not a shake-out; it is a structural VWAP Flip. Buyers who accumulated along the rising AVWAP will be trapped underwater, turning previous support into dynamic resistance. If the market accepts trading below this line, traders must abandon their bullish bias and shift to short-side or capital preservation strategies.
Ultimately, reclaiming the AVWAP by itself does not prove buyers are safe; the market must show subsequent price acceptance. Until the chart provides objective evidence that buyers are defending the line with momentum, traders should stand aside and let the market prove its intentions.